Riparian
An adventure in turning a financial consultancy’s business model into a bespoke SaaS product.
Role
Lead Designer
Information Architecture
Wireframes
UI Design
Click-Through Prototype
Agency
Momentum Design Lab
Industry
Financial, Healthcare, B2B
The ask
Turn a financial consultancy’s business into a self-serve SaaS product for their clients.
Details
- Their services focus on government price reporting for pharmaceuticals.
- Automating their manual process into software that clients can use.
Pain Points
- Client teams have a variety of methods—need to find common ground.
- The software used to perform these tasks hasn’t been updated in over 15 years.
- Process to calculate numbers is mostly done in Excel and Access, which are easily overloaded, or simply on whiteboards, which have high margin of error.
Research
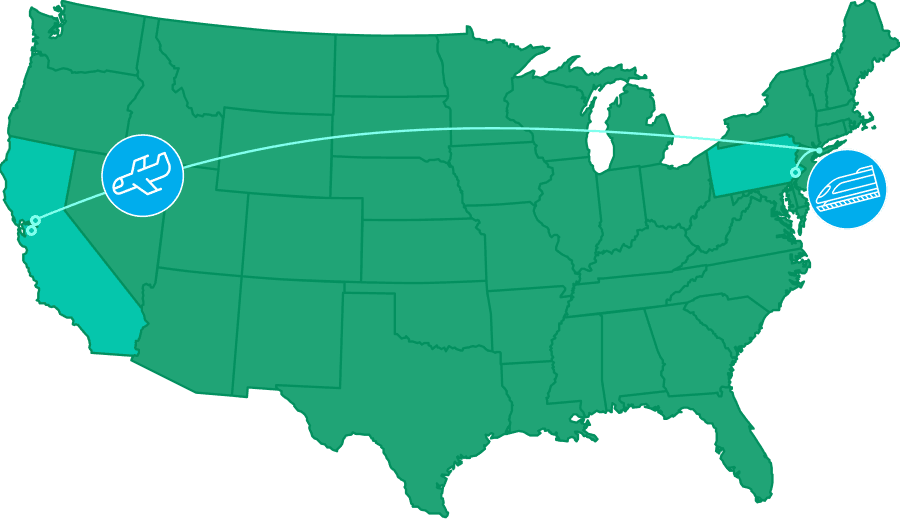
Our team visited several of our client’s clients, pharmaceutical company finance teams, to inquire about the details of their process
Initial Findings
While the process of calculating prices for reporting is fairly similar across the board, the way each team handles it is quite different.

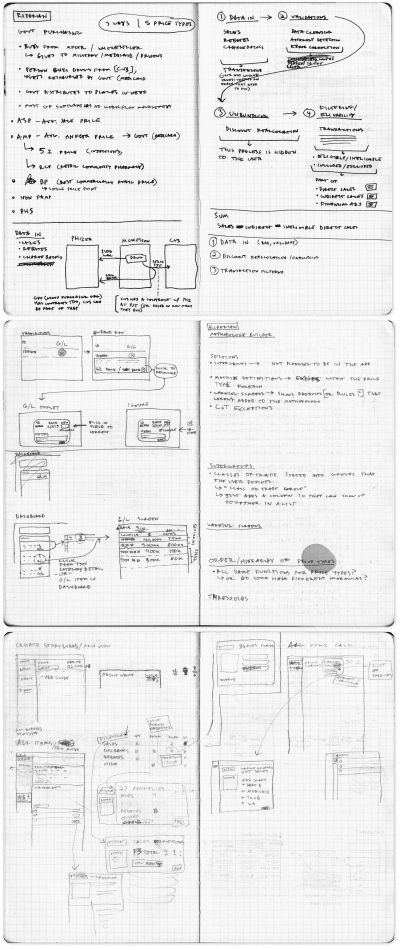
Task Breakdowns
Two Questions to Solve:
How to define these roles?
Tasks can be done by one or multiple people, with varying titles.
How to divide the tasks?
What are the specific steps of the process and where are they connected or separate?
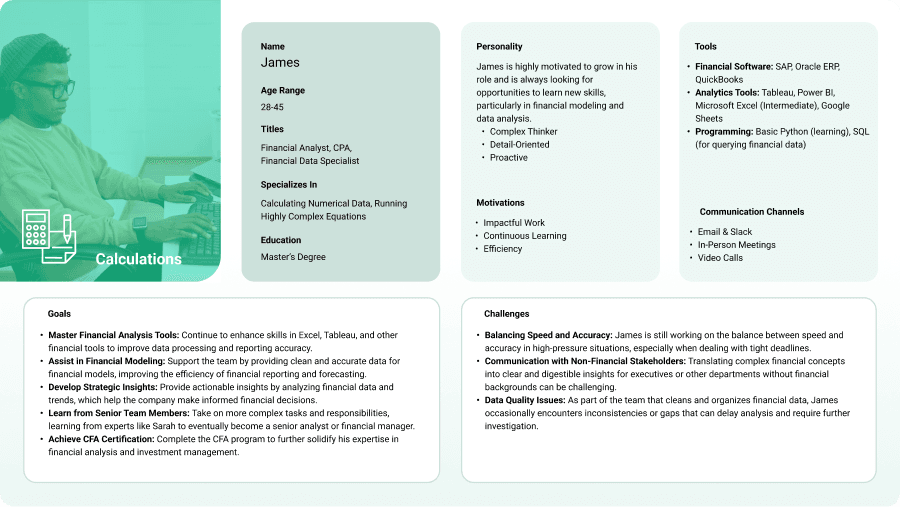
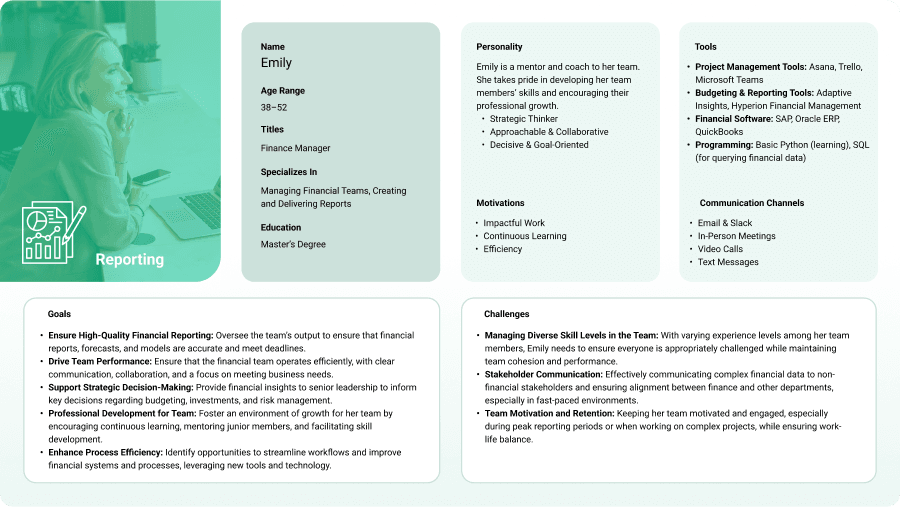
Identifying the Users
Our client was a consultancy to the financial teams of pharmaceutical companies, and would help them with their process of processing data, calculating numbers, and creating reports that are sent to the government to set prices in programs like Medicare.
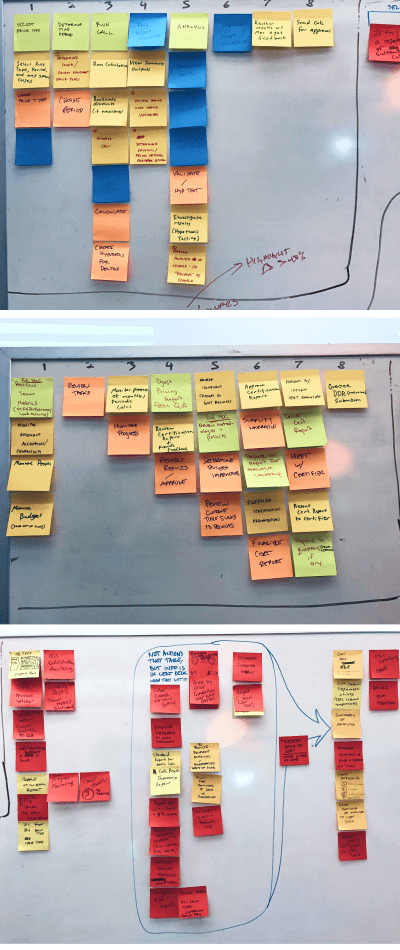
Define the client’s process and identify jobs to be done
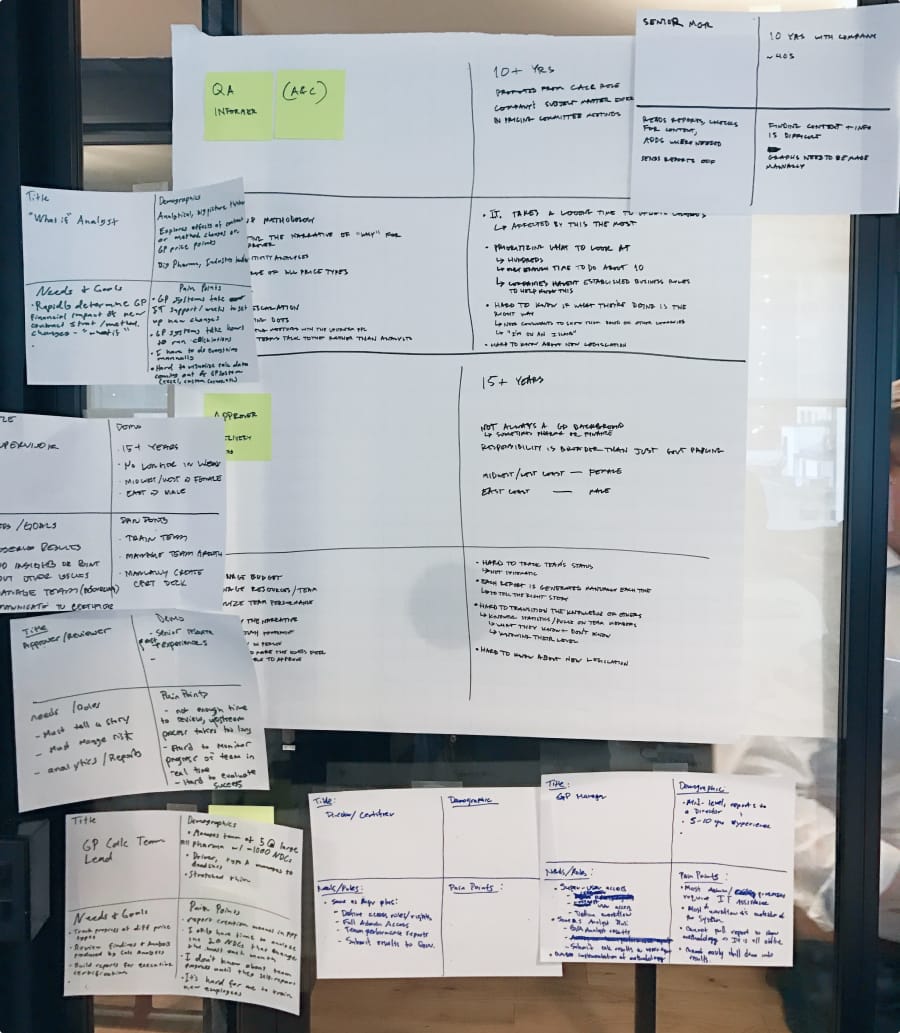
We returned to share our research findings with our client, and I facilitated a week long workshop to identify threads between all of the information given to us in our interviews.
We defined common jobs to be done throughout the process, and grouped them into roles to begin defining the shape and structure of the app.
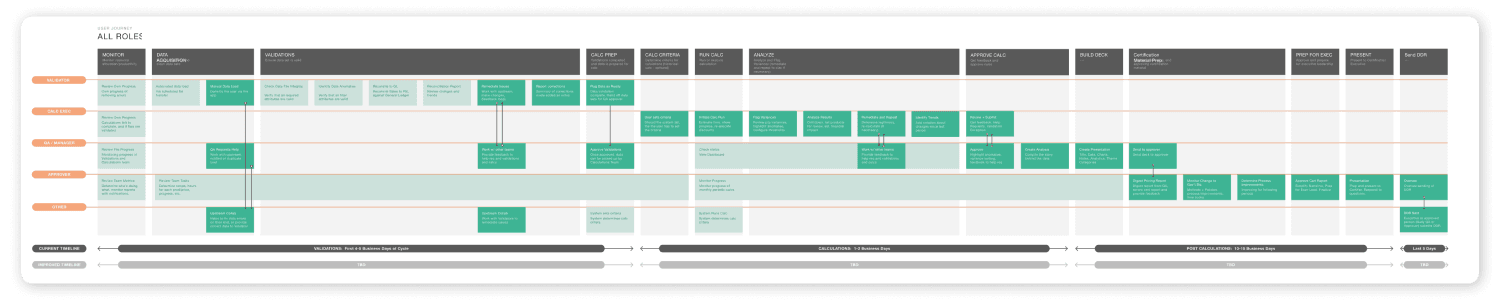
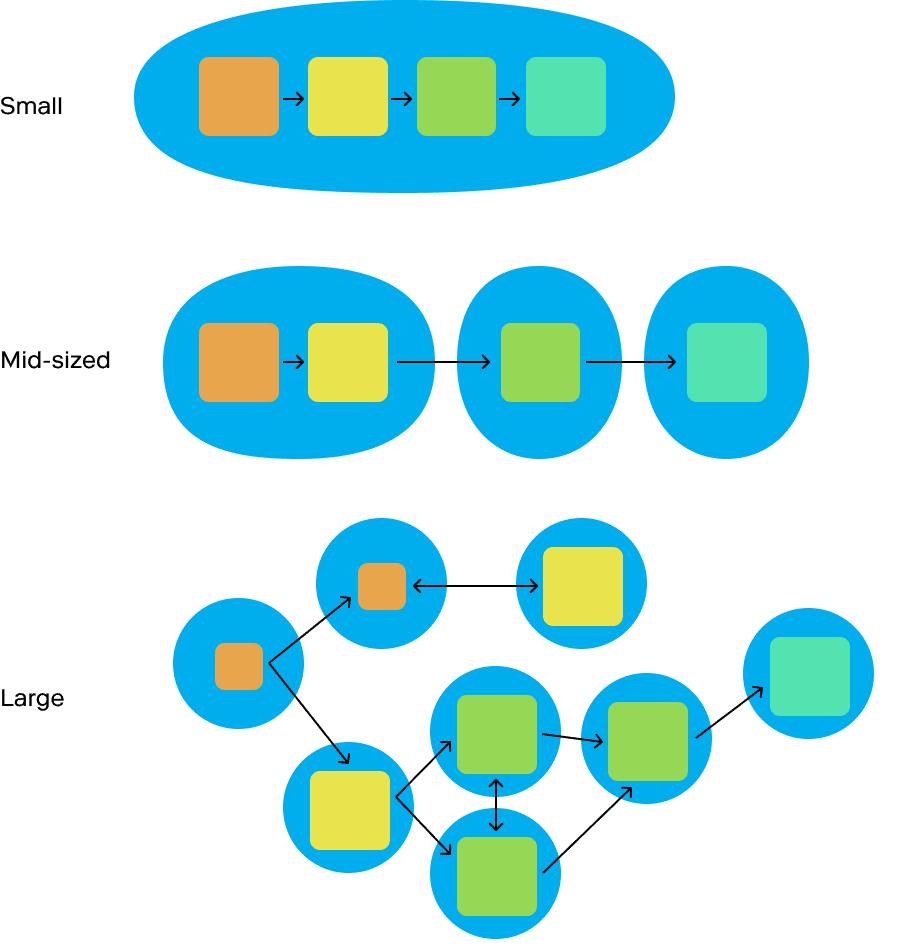
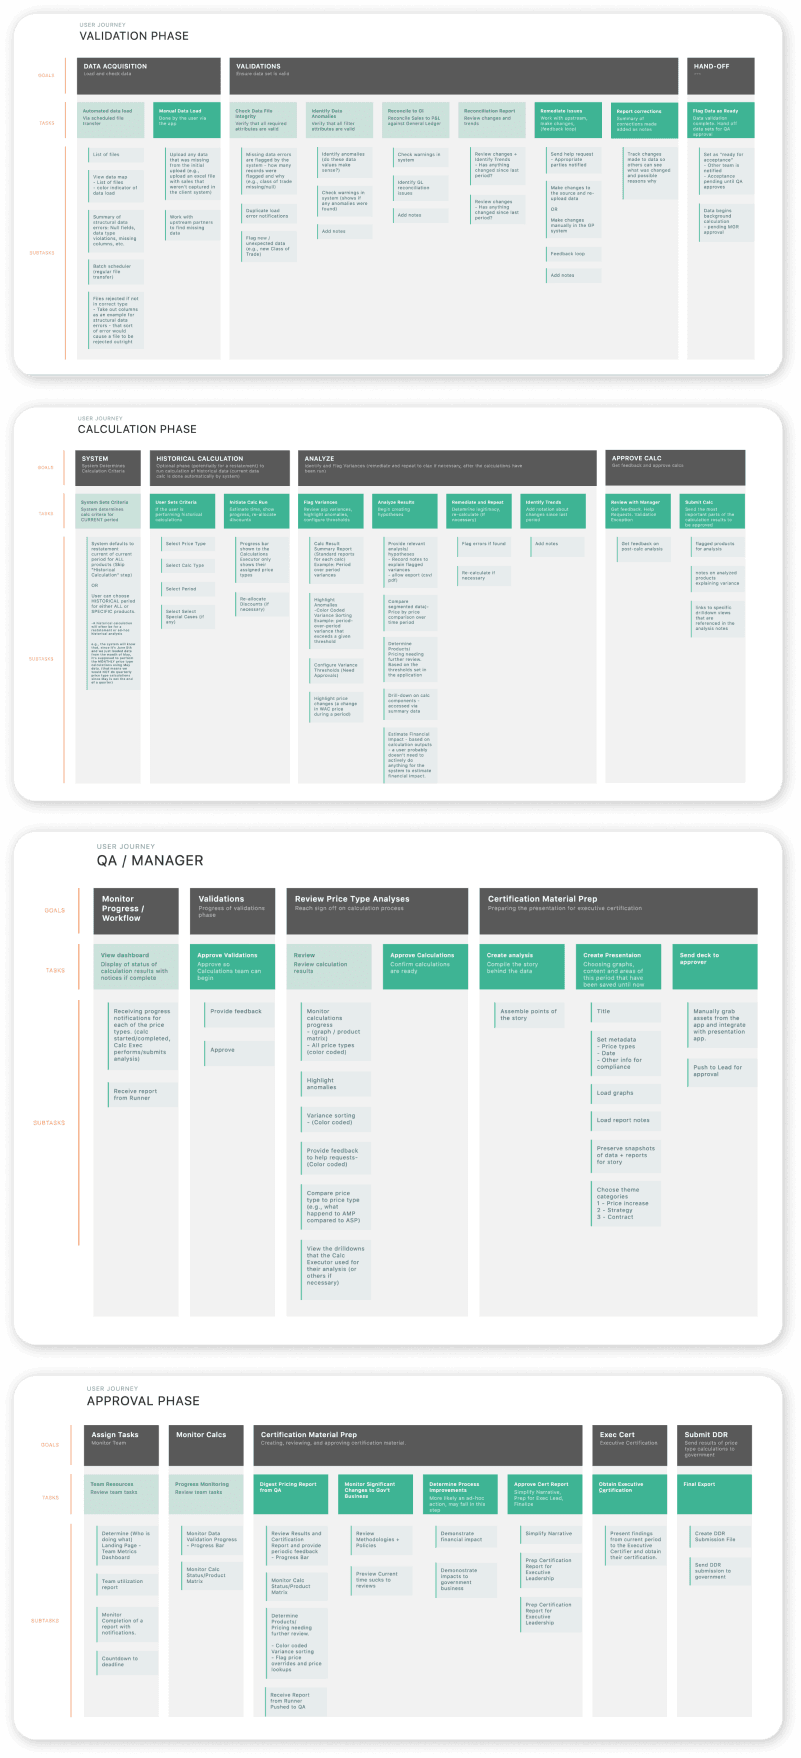
User Journeys
Creating one main journey for the process, and splitting it into user journeys for each role in the process was beneficial to understand the individual steps that would become features for each section of the app, as well as communicate the expectations of what would be built with our client.
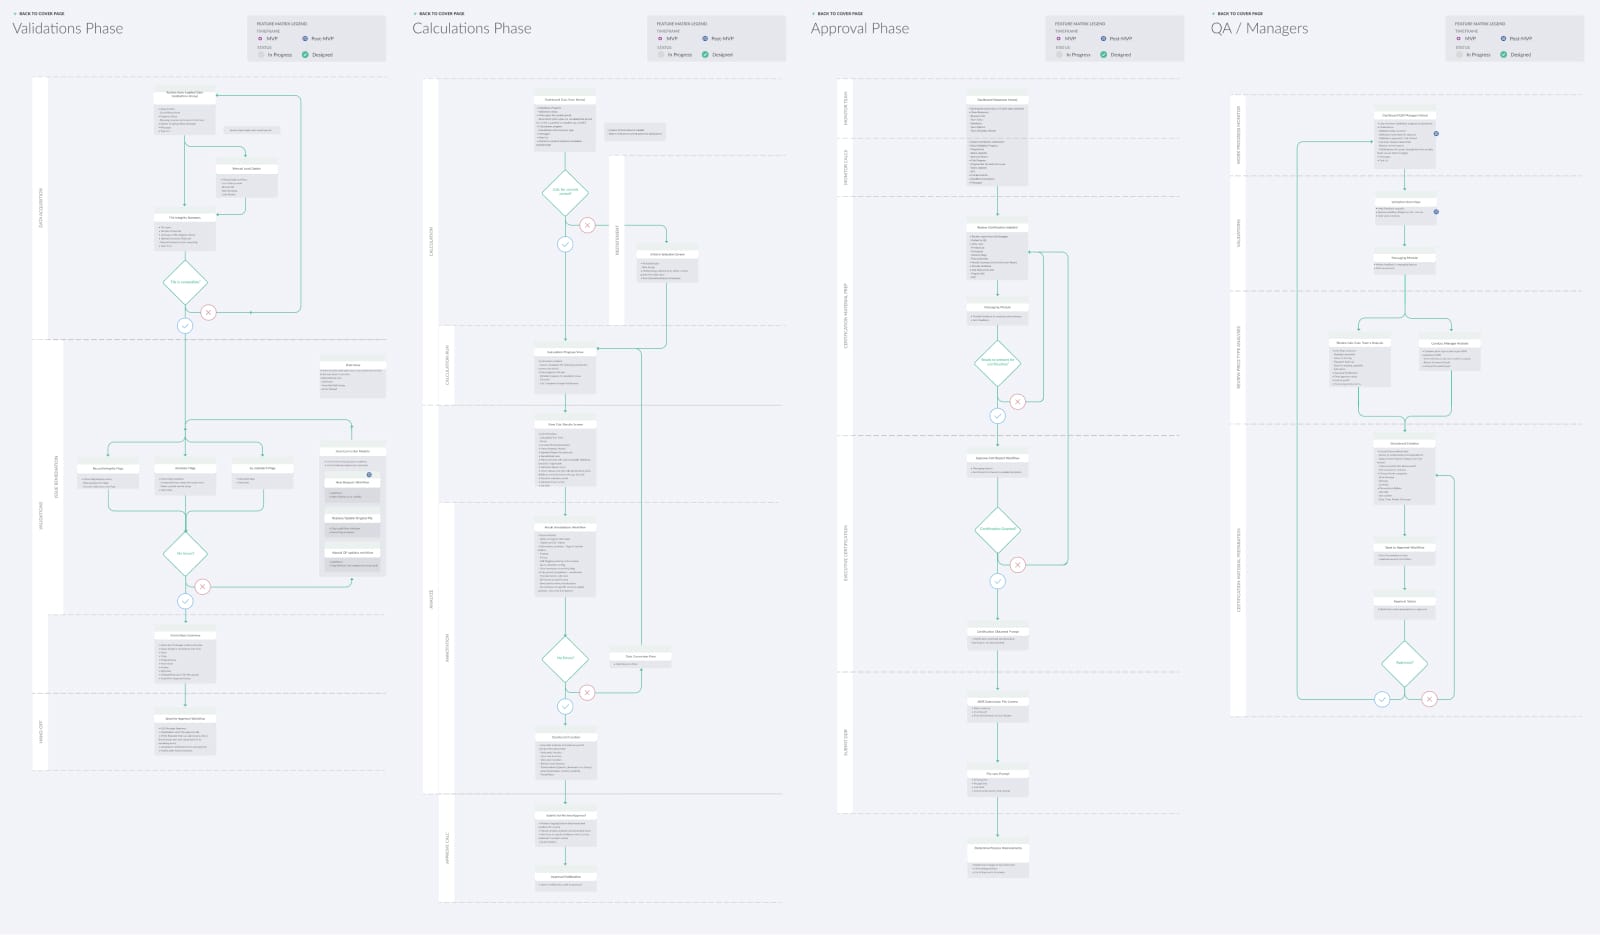
Information Architecture
Seeing the shape of the process in this format helped to visualize how the steps of the process are fairly straightforward, and while there can be some looping, the goal is to get from one step to the next quickly and clearly.
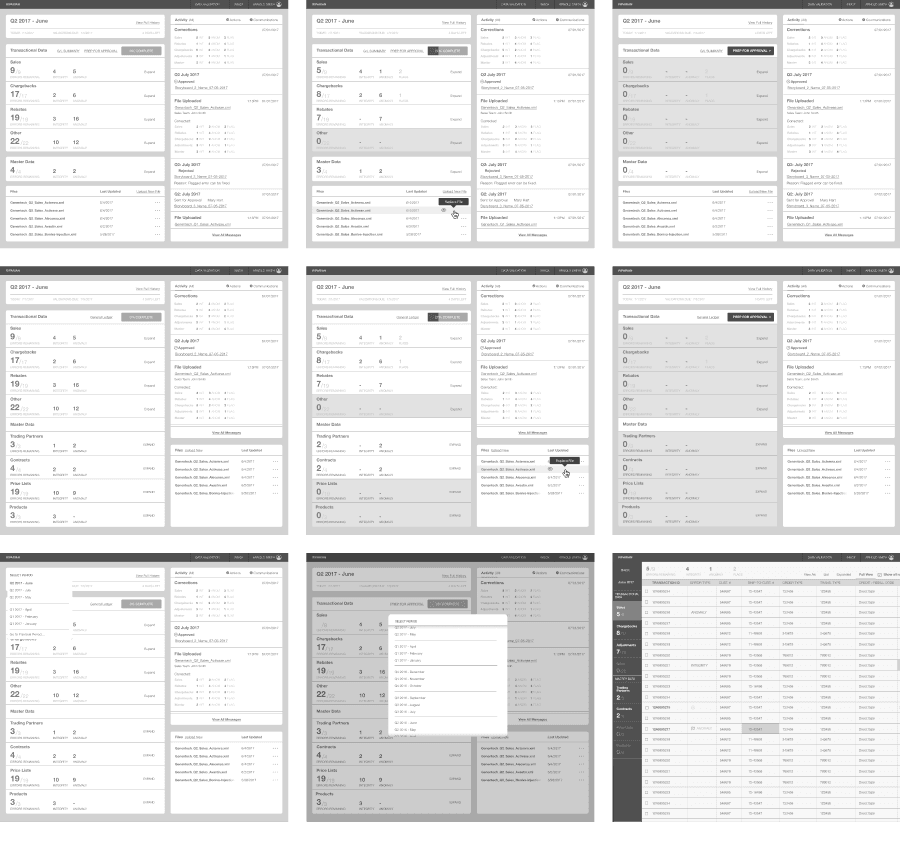
Wireframes
We completed several passes at functions for a dashboard, error correction, and calculations phases. Our focus was to communicate team progress in a relevant way for both management and the individuals completing these phases.
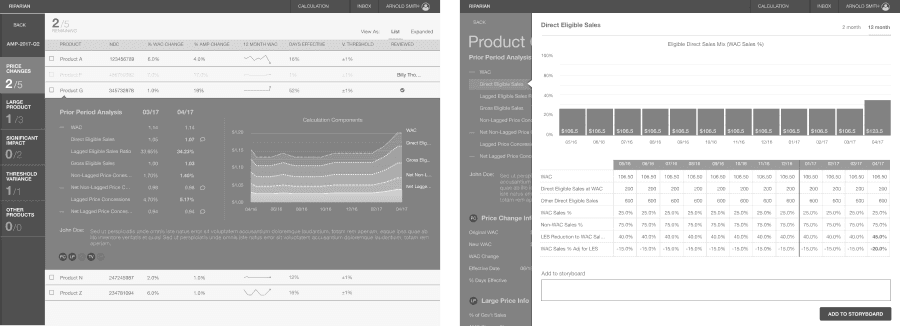
Charts & Graphs
Many of the information being processed ultimately ends up as charts which would be used in presentations to explain reasons for why prices changed. We focused the designs around being able to track the necessary information with notes, for later use in presentations to management.
Dashboard
The dashboard gives an overview of the team’s progress as well as individual progress, notes, and cross-analyst shared details.
Data is first validated from its many sources and funneled into a set of databases for calculations.
Then calculations are run and outlying price changes can be saved and notated for use in reports and presentations.
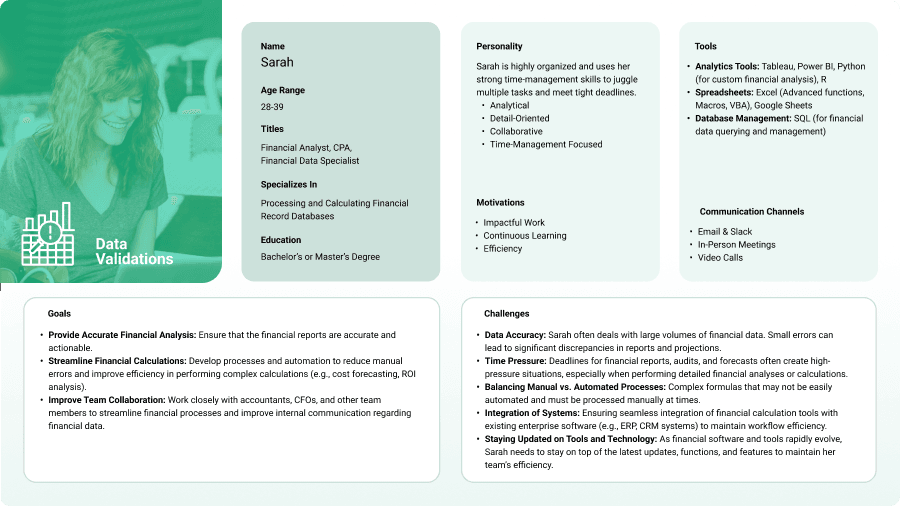
Data Validation
With many sources of data being amalgamated into sets of records, some of the sources have incorrect data. This is one of the most time consuming steps to correct the errors, so the data can be calculated accurately.
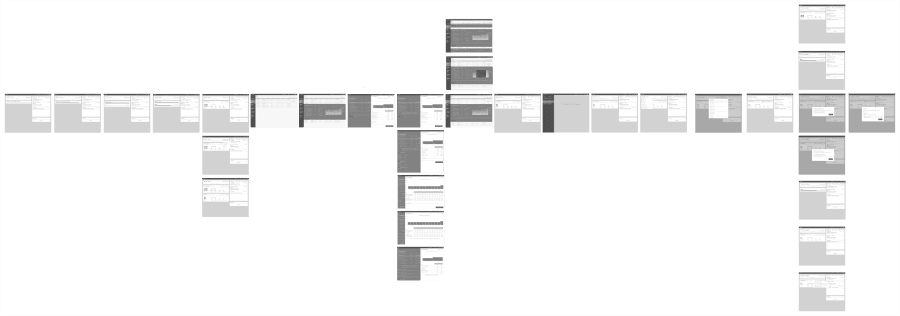
Price Calculations
Calculations are sorted by types of records, and then by products, so the primary task at this step is to identify and call out big changes. These would require adding notes and being reviewed by management to make sure the changes were due to reasons like sales or discounts, rather than numerical errors.